

Q3 2026 Deep Dive: Items vs. Policies – How to Read SLTX Counts
Introduction
Each month SLTX publishes its Policy and Premium Report, a high-level summary of the Texas surplus lines market: the premium reported during the month, the number of policies behind that premium, and the number of items filed, each shown alongside the same month of the prior year. For many readers, it is the first place they turn to gauge how the market is moving.
The premium figure draws the most attention, but the two counts carry information that premium cannot. Premium is shaped by both rate and activity: in a hardening market, premium can grow substantially while the number of risks placed barely moves, and in a softening market the reverse can occur. Policy count is the closest measure of how many risks were placed, which makes it a signal of market activity. Item count captures the full volume of filings flowing through SLTX, whether or not that activity represents new business. The two are related, but they are not interchangeable, and each answers a different question.
The chart below shows why counts belong alongside premium. From 2018 through 2022, premium grew by double digits every year while the number of policies was flat or declining; in 2022, premium rose 27% on less than 1% more policies. Premium growth has moderated each year since, to 10% in 2025, while policy counts grew nearly 15% that year and premium per policy declined. All of 2025’s premium growth, in other words, came from more policies being placed, not from more premium on each one.
The 2026 bar needs a caveat. Year to date, the published policy count is up roughly 71% against premium growth of about 6%, but through June the figures were 27% and 5%, a continuation of the 2024–2025 pattern. The difference is a single large block of new-policy filings reported in July and substantially reversed in August. Because reversals of policies are themselves counted in the published policy count, both months inflated the total. Part 1 introduces the active item count, which separates reversed filings from activity that still stands, and Part 2 walks through how this block arose. The difference is a single large block of new-policy filings reported in July and substantially reversed in August. Because reversals of policies are themselves counted in the published policy count, both months inflated the total. Part 1 identifies where this activity appears within the published item count, and Part 2 walks through how this block arose.
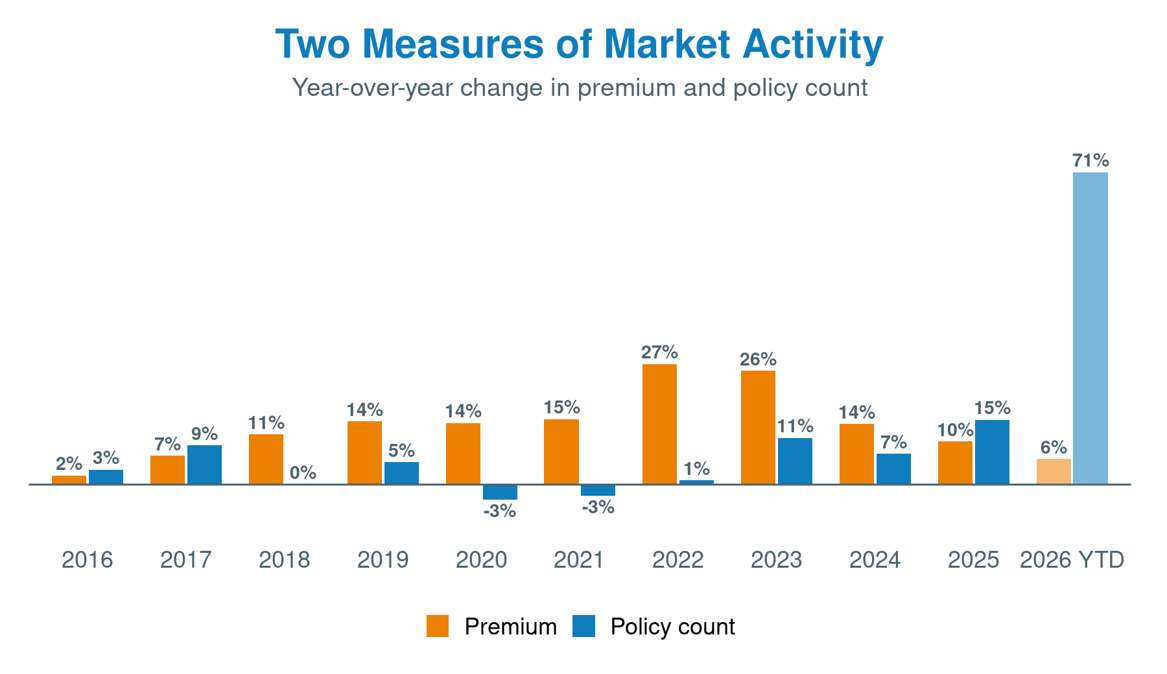 Figure 1: Year-over-year change in total premium and in policy count reported to SLTX, 2016–Q3 2026. The 2026 policy count is as published and includes a large block of new policies reported in July and reversed in August; see Part 2.
Read one way, the market grew rapidly through 2023 and has slowed since. Read the other way, the market placed more risks in 2024 and 2025 than in any prior year of the series, and 2026 is on pace to exceed both even after July and August are set aside.
Before analyzing item and policy counts further, it is worth defining items and policies precisely.
A. Item
An item is a single record in the SLTX system. Each item carries its own unique identifier, and each represents one filing action taken by an agent or broker. It is the atomic unit of activity in SLTX data. New and renewal policies are items. So are binders, endorsements, cancellations, reinstatements, audits, and installments. So, too, are the transactions that correct or undo other transactions: reversals and re-entries. If a filing agent takes an action that SLTX records, that action is an item and is recorded in the month it was reported.
B. Policy
A policy, for counting purposes, is a subset of items. It is a new or renewal policy or binder, including a policy filed to replace a binder previously reported. It is the basis for the policy count published on the Policy and Premium Report and is counted when the policy was reported to SLTX, not when it was written.
Item counts answer the question “how much filing activity did SLTX process?” They are an operational measure. Policy counts are specific to new and renewal policy and binder transactions, excluding post-placement activity.
For a simple policy with no subsequent activity, one policy is one item. Over the life of a typical policy, however, one policy can generate several items: the original filing, one or more endorsements, perhaps a cancellation and a reinstatement, perhaps an audit endorsement. Each of those items is real activity that SLTX must process, record, and store, but only the first of them is a policy.
Part 1: The Anatomy of an Item
The full “item count” includes every transaction reported to SLTX: new and renewal policies and binders; post-placement activity such as endorsements, cancellations, reinstatements, audits, and installments; and procedural activity, such as reversing and re-entering a transaction to correct an earlier filing.
In 2025, SLTX recorded about 1.43 million items. New policies were the single largest type at about 32% of the total, and renewal policies were next at about 27%. Binders, which are counted as policies, added another 6%. Taken together, policy-type items made up roughly two-thirds of all items filed during the year.
The remaining third is mostly post-placement activity. Premium endorsements alone accounted for about 22% of all items, or more than 310,000 records. Cancellations accounted for close to 9%. Reinstatements, audits, installments, and non-premium endorsements each contributed a fraction of a percent. Reversals of all kinds totaled about 30,000 items, or 2.1% of the year.
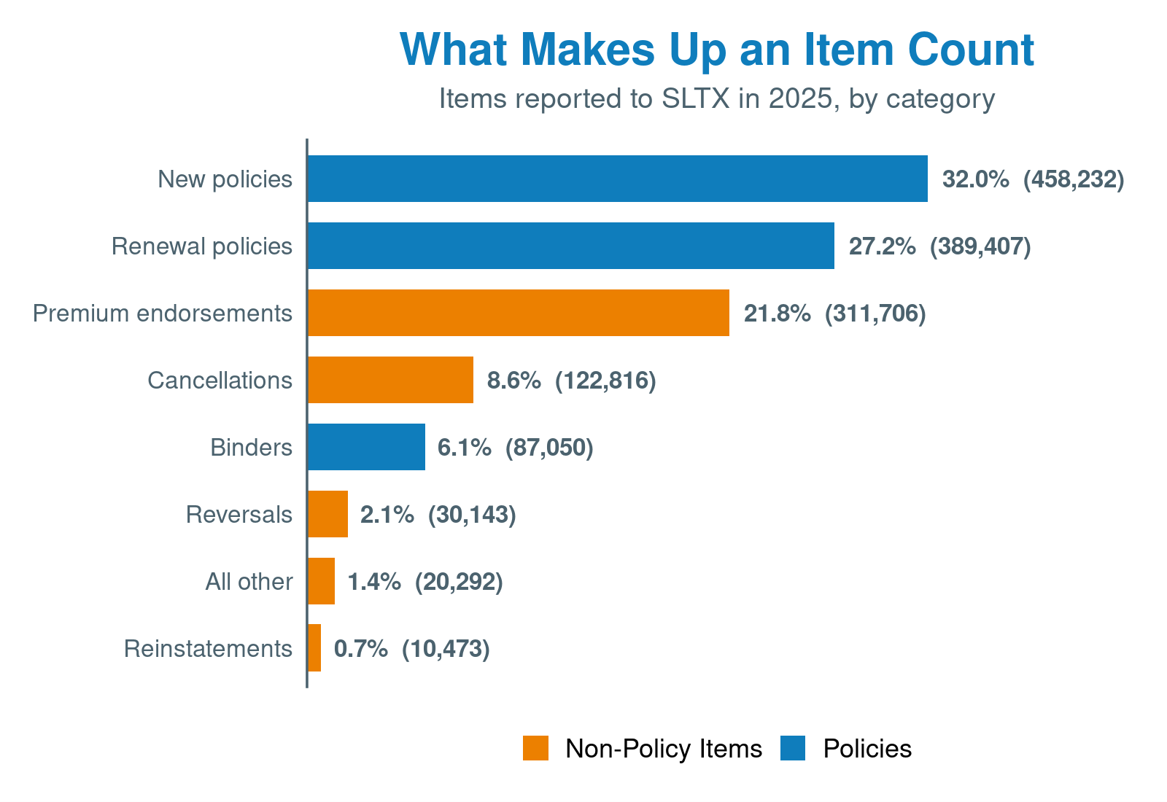 Figure 2: Composition of items reported to SLTX in 2025, by category.
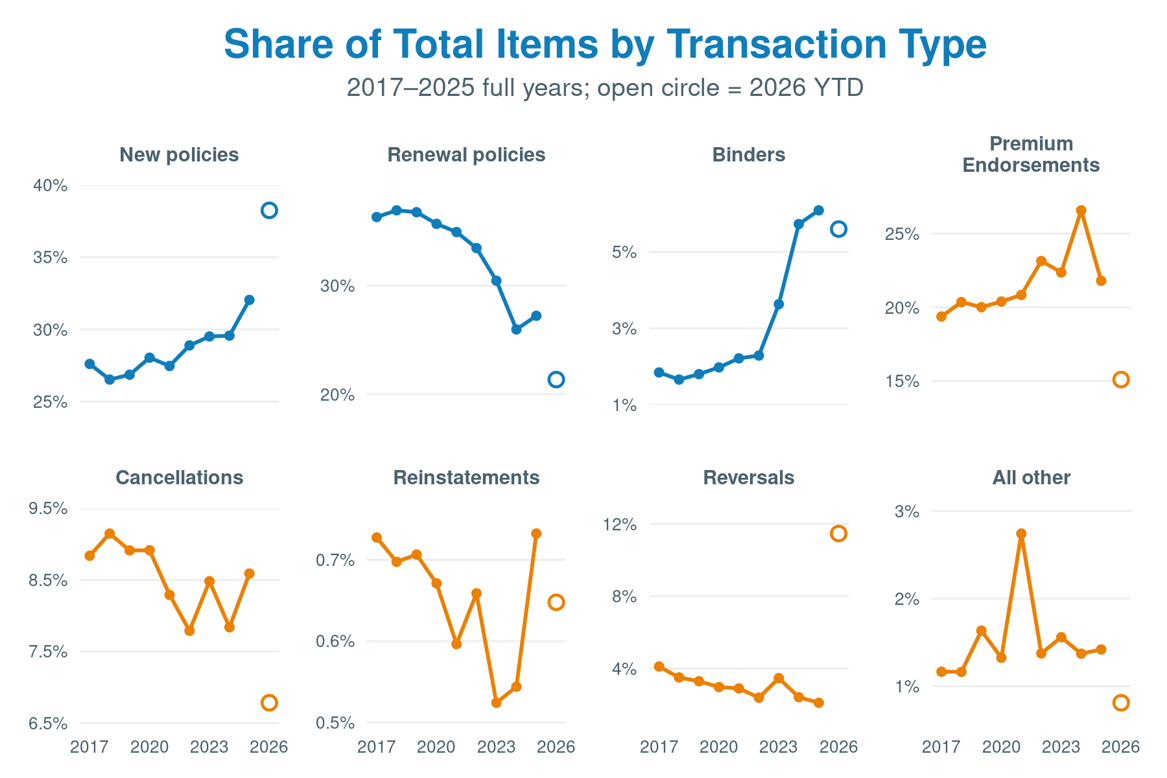
Figure 3: Percent of items attributable to each transaction type and year, 2017–2026.
Policies and binders make up the largest share of items in every year, and their combined share has stayed between roughly 61% and 66% since 2017. Within that share, new policies have risen from about 28% of items in 2017 to 32% in 2025, while renewal policies have fallen from about 36% to 27% in the same period.
Among the other transaction types, cancellations (about 8% to 10% of items in every year) and reinstatements (under 1%) are the most stable. Premium endorsements range from about 19% to 27%, peaking in 2024. Reversals and the “all other” groups are the noisiest transaction types relative to their size.
Reversal Activity in the Item Count
In the normal course of reporting, brokers may need to correct a filing after it has been finalized. A reversal is an item, and the item it reverses is also an item, but neither represents business that is in force.
A correction therefore leaves two additional items in the count: the reversal, counted in the month it is filed, and the original it reverses, which remains in the count of the month in which it was reported. To measure the effect of this activity, this article refers to an item that is neither a reversal nor an original that has since been reversed as an active item, and to the number of such items reported in a month as that month’s active items.
Active items are evaluated as of a specific date, not as of the month’s close; the figures in this article were calculated as of September 30, 2026. Because items can be corrected after month-end, a prior month’s active items can only fall over time as later reversals arrive. That makes the measure a direct numeric expression of the “living database” that Part 2 describes.
Table 1: Items reported to SLTX in 2025 as published, reversal activity in both directions, and the resulting active item count. Reversed items are originals reported in 2025 that have since been reversed.
| Items as published | Reversal items | Reversed items | Active items | Inactive Share |
| 1,432,419 | 30,143 | 23,579 | 1,378,697 | 3.6% |
In a normal year the difference is small. As of September 30, of the 1.43 million items reported in 2025, about 30,000 were reversals and about 23,000 were originals later reversed, leaving 1.38 million active items, or 96.4% of the published figure. The share of items relating to reversals has decreased over the series, from 7.4% in 2015 to 3.6% in 2025, which suggests that filing accuracy has improved even as volume has grown.
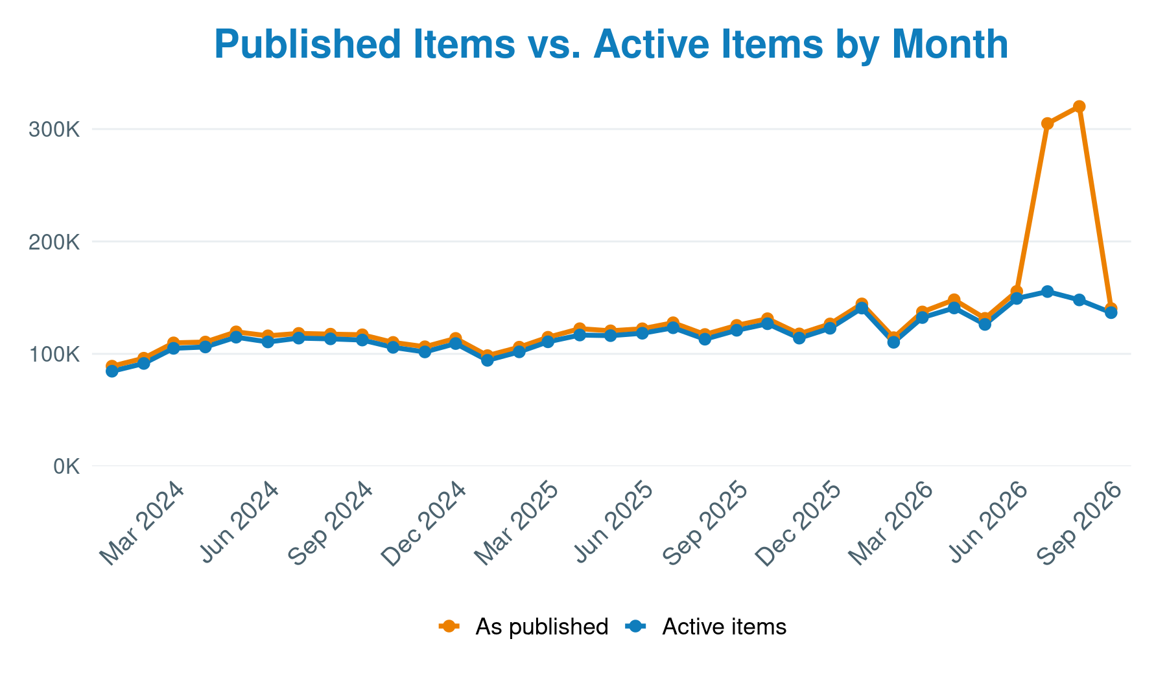 Figure 4: Monthly items reported to SLTX as published, and the active item count for the same months, January 2024 through September 2026.
Typically, the difference between the item count published in the Policy and Premium Report and the active items for the same month is immaterial and predictable. When it is not, the gap between the two is a direct reading of how much of a month’s reported activity was filing correction rather than business.
Part 2: A Living Database, a Fixed Report
The SLTX database changes as items are reversed; the Policy and Premium Report does not. Once an item is created, its record persists. A reversal does not delete the original item; it adds a new item that points back to the original. The status of an active item, however, can change after the fact. A filer can reverse a policy months after it was originally reported, and when that happens, the policy no longer counts toward the market as of today.
The interaction between a dynamic database and a fixed report is easiest to see on a single policy. Consider one real renewal policy filed with SLTX this year. It was reported and in effect in July 2026. In August, the filer reversed it. In September, the filer re-entered it with corrected data elements. The table below shows what each month’s published report reflects for this one policy.
Table 2: One renewal policy reported in July 2026, reversed in August, and re-entered in September, as reflected in each month’s published report.
| Report month | Item posted | Item count | Policy count (on Policy and Premium Report) | Active items (today) | Premium |
| July 2026 | Renewal Policy | +1 | +1 | 0 | Full policy premium |
| August 2026 | Renewal Reversal | +1 | +1 (negative premium) | 0 | Full premium, negative |
| September 2026 | Renewal Policy (re-entry) | +1 | +1 | +1 | Full policy premium |
Point-in-time counts are faithful to the month as it closed. The July report correctly shows this policy, because in July it was a valid policy. Subsequent corrections live in later months’ data, not in July’s. Item counts never overstate or understate operations. Every one of the three actions above was real work that SLTX processed. One active item is also the right number: a single policy is in force.
A reader who sums monthly policy counts across the year will count this risk more than once. Summing premium across months is valid because the reversal’s negative premium nets the original entry out. Typically, the volume impact on counts is small: in 2025, about 8,100 policies were reversed in a month later than the one in which they were originally reported, or under 1% of the year’s policy count. That figure has fallen each year since 2023, when it was about 17,200.
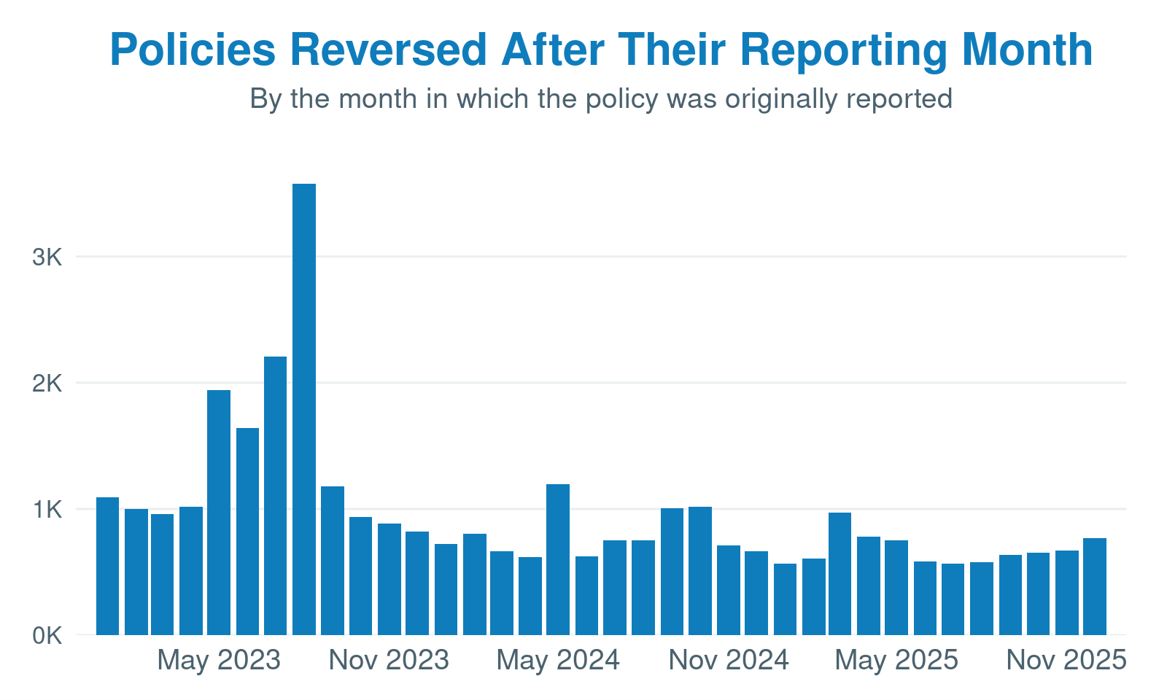
Figure 5: Policies reversed in a later month than the one in which they were originally reported, by original reporting month, 2023–2025.
The same mechanics explain July and August 2026. The July report showed about 261,000 policies and 305,000 items, roughly two and a half times a typical month, driven by an unusually large block of new-policy filings from a single broker. The August report showed about 276,000 policies and 321,000 items, nearly 158,000 of them new-policy reversals. Read separately, each looks like an extraordinary month; read together, they describe one large filing reported and then largely reversed. Premium nets out with reversal activity but the published counts do not: originals and reversals are both policy-type items, so both months add to the policy count and to the year-to-date total. Net of reversals and reversed originals, July and August were in line with recent trends, with about 155,000 and 148,000 items, respectively.
Conclusion
Item counts and policy counts each describe a different part of SLTX activity and reading them correctly depends on knowing what each one includes and when it was measured.
Which count for which question. To measure market activity or the volume of new business, use policy counts; they are unaffected by rate changes and by post-placement servicing. To understand SLTX operational volume or filing behavior, use item counts; they capture everything filers submit.
Common misreadings:
- Treating an item count as a policy count. This overstates the market by roughly half, since the item-to-policy ratio has hovered around 1.5 for a decade.
- Treating a month’s published count as a real-time figure. It reflects the month at close; later reversals and re-entries appear in later months.
- Reading a spike in reversal items as market activity. Reversals are corrections, and their volume says nothing about business placed.
Alongside premium, counts offer a second lens on the surplus lines market and SLTX operations. When premium and policy counts diverge, as they have in both directions over the last decade, the divergence is itself informative: it separates the part of premium growth that reflects more risks being placed from the part that reflects more premium per risk, and it is the difference between a market that is slowing and one whose growth has simply changed shape.